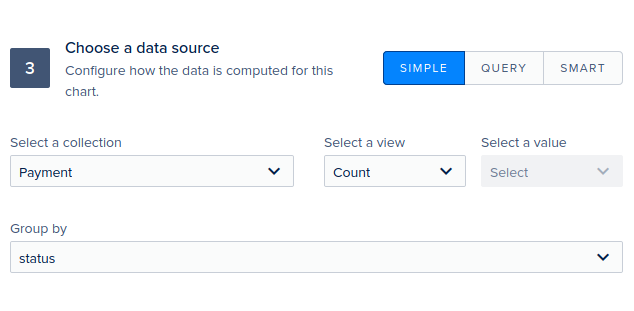
Hi, I previously setup a a model Payment with some status as en enum and I setup on the dashboard a repartition chart grouping by status.
Possible statuses were PROCESSING, SUCCEEDED and CAPTURING + some others.
Then I added a status (CAPTURING) in the enum but this status by adding it in the model definition.
The problem is in every environment.
code example
const Model = sequelize.define('payment', {
    status: {
      type: DataTypes.ENUM(
        'PROCESSING',
        'SUCCEEDED',
        'FAILED',
        'CAPTURING',
      ),
    },
...
}, {
    tableName: 'payment',
    timestamps: false,
    schema: process.env.DATABASE_SCHEMA,
  });
Expected behavior
The repartition chart should show the number of payment by the recently added status.
Actual behavior
New status are Others

Context
- Express Version: 4.16.3
- Sequelize Version: 5.21.3
- Database Dialect: Posgresql
- Database Version: 11
- Project Name: backend-billee-api
Hello @Nicolas_S 
May I see the declaration of the ENUM in your database please ?
Also, may I see the payload of the http request to retrieve the chart data please ? It should be a call to : http://localhost:3310/forest/stats/payments
Thanks in advance.
Steve.
Declaration in the DB
CREATE TYPE payment_status AS ENUM ('PENDING', 'PROCESSING', 'SUCCEEDED', 'FAILED', 'CANCELED');
-- Then later
ALTER TYPE payment_status ADD VALUE IF NOT EXISTS 'OPEN';
ALTER TYPE payment_status ADD VALUE IF NOT EXISTS 'EXPIRED';
ALTER TYPE payment_status ADD VALUE IF NOT EXISTS 'CAPTURING';
Response from /forest/stats/payments
{
	"data": {
		"type": "stats",
		"id": "ade3f8b0-0339-11eb-a6a7-dbf74f5fe483",
		"attributes": {
			"value": [
				{
					"key": "SUCCEEDED",
					"value": "2053"
				},
				{
					"key": "PROCESSING",
					"value": "102"
				},
				{
					"key": "FAILED",
					"value": "96"
				},
				{
					"key": "CANCELED",
					"value": "42"
				},
				{
					"key": "OPEN",
					"value": "41"
				},
				{
					"key": "EXPIRED",
					"value": "13"
				},
				{
					"key": "PENDING",
					"value": "3"
				}
			]
		}
	}
}

Hi @Nicolas_S,
I just did a quick test on my end and I’m getting the same results as yours (Expect for your first screenshot, where you are not getting the number of payment).
From what I see this is currently not possible to display more than 6 category using the “Repartition” chart (Including the “Others” category). Seeing your chart, the reason seems clear to me: with more than 6 category you wouldn’t be able to hover the last 2 categories on that chart.
Still, I’ll push this as a suggestion to our product board.
In the meantime, I would suggest to create multiple graph for your specific case, or use the Filter feature to ignore category to have 6 groups or less.
Hope that helps.