Feature(s) impacted
The app / dashboard performance
Observed behavior
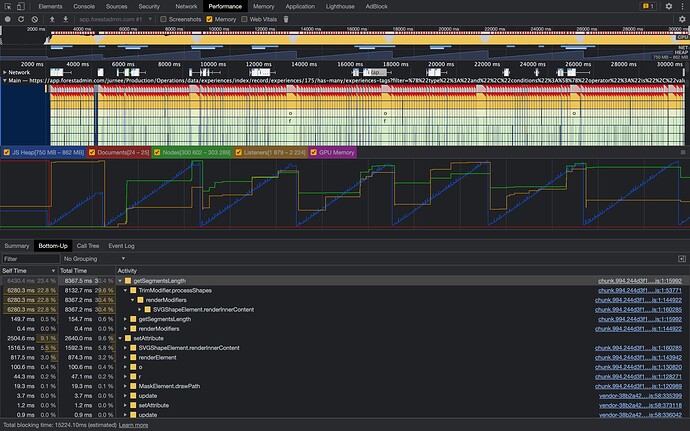
After 1 hour of use the app become very very slow, I took a look in the dev tools and it seems linked to a memory leak.
Expected behavior
The app doesn’t slow down after one hour of use.
Failure Logs
Screenshot:
Dev tools profiling export:
Context
- Project name: Jurnee
- Team name: Operations
- Environment name: Production
- Agent type & version: Node latest version
- Recent changes made on your end if any: Nothing
Hello @Dammmien,
Is your issue related to a specific collection / specific segment? If so, can you share your model definition or anything that can help us to reproduce your issue?
Kind regards,
Louis
Hello Louis,
I did a lot of back and forth between the index and details view of a collection, but the table is quite standard only few hundreds rows, about twenty columns but only 10 displayed in the index. A smart field which simply calculates a status based on the other fields. My goal was to add some many-to-many relations between this collection and another one very standard too.
The issue doesn’t seem related to the model / collections and everything is ok backend side. However, I have the impression that it is a performance issue on the front-end side. We see in the profiling export that the DOM reaches +300,000 nodes, which is not common, and we see that the CPU spends a lot of time in SVG rendering functions.
Hello @Dammmien,
Thanks for these details.
We are trying to reproduce your issue so that we can fix it and it would never occur again.
So far, no chance.
Can you just tell us if you encounter the issue again? Are you able to reproduce it on your side?
Thanks.
